About this app
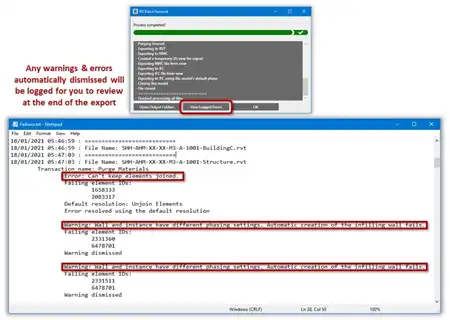
ConsoleCapture is a valuable tool for developers working with Autodesk® Revit® and other add-ins. This plugin allows users to display debug logs in real-time, making it easier to debug and troubleshoot their add-ins. In this review, we will explore the features of ConsoleCapture and how it can enhance your development workflow.
Features of ConsoleCapture
ConsoleCapture offers a range of useful features that streamline the debugging process for developers. One key feature is the ability to search for keywords such as class names or messages using the search bar at the top of the panel. This makes it easy to quickly locate specific information within the logs.
Another handy feature is the ability to show or hide columns using the buttons in the side menu. Users can toggle the visibility of each column to customize their view. Additionally, users can show or hide rows with CONSOLE or DEBUG types, allowing for a more focused analysis of the debug logs.
ConsoleCapture also supports selective copying of rows. By selecting a row and pressing Ctrl + C, users can copy only the selected row. For bulk copying, users can click the copy button in the upper right corner of the panel to copy all rows at once. These copying options make it easy to share log information with team members or save it for future reference.

(Image by: 👨🏻💻Shotaro TAKAZOE)
Debug Log Output Methods
ConsoleCapture supports three main methods for outputting debug logs: using the Console class, the Trace class, and the Debug class. Each method has its own use case and benefits.
The Console class is used to display messages to standard output or standard error output as part of the program. Users can use Console.WriteLine to display a message with a newline, Console.Write to display a message without a newline, and Console.Error.WriteLine to display an error message with a newline. This class is useful for displaying general information and error messages during program execution.
The Trace class is used for logs that may be output even in the production version of the application. Users can use Trace.WriteLine to display a message with a newline, Trace.Write to display a message without a newline, and Trace.TraceInformation to format and display a message with a newline. This class is helpful for tracking information that may be useful for troubleshooting in a production environment.
The Debug class is specifically designed for logs that are only needed during debugging. These logs are enabled in the debug build and disabled in the release build. Users can use Debug.WriteLine to display a message with a newline, Debug.Write to display a message without a newline, and Debug.Print to format and display a message with a newline. This class is essential for developers to track information during the debugging process.

(Image by: 👨🏻💻Shotaro TAKAZOE)
Conclusion
ConsoleCapture is a must-have tool for developers working with Autodesk® Revit® and add-ins. Its real-time log display, search functionality, and selective copying capabilities make it a valuable asset for debugging and troubleshooting. By supporting multiple output methods for debug logs, ConsoleCapture provides flexibility and customization to meet the needs of developers.
We highly recommend trying out ConsoleCapture to streamline your development workflow and enhance your debugging process. With its intuitive interface and powerful features, ConsoleCapture is a game-changer for developers working with Autodesk® Revit®.

(Image by: 👨🏻💻Shotaro TAKAZOE)

(Image by: 👨🏻💻Shotaro TAKAZOE)